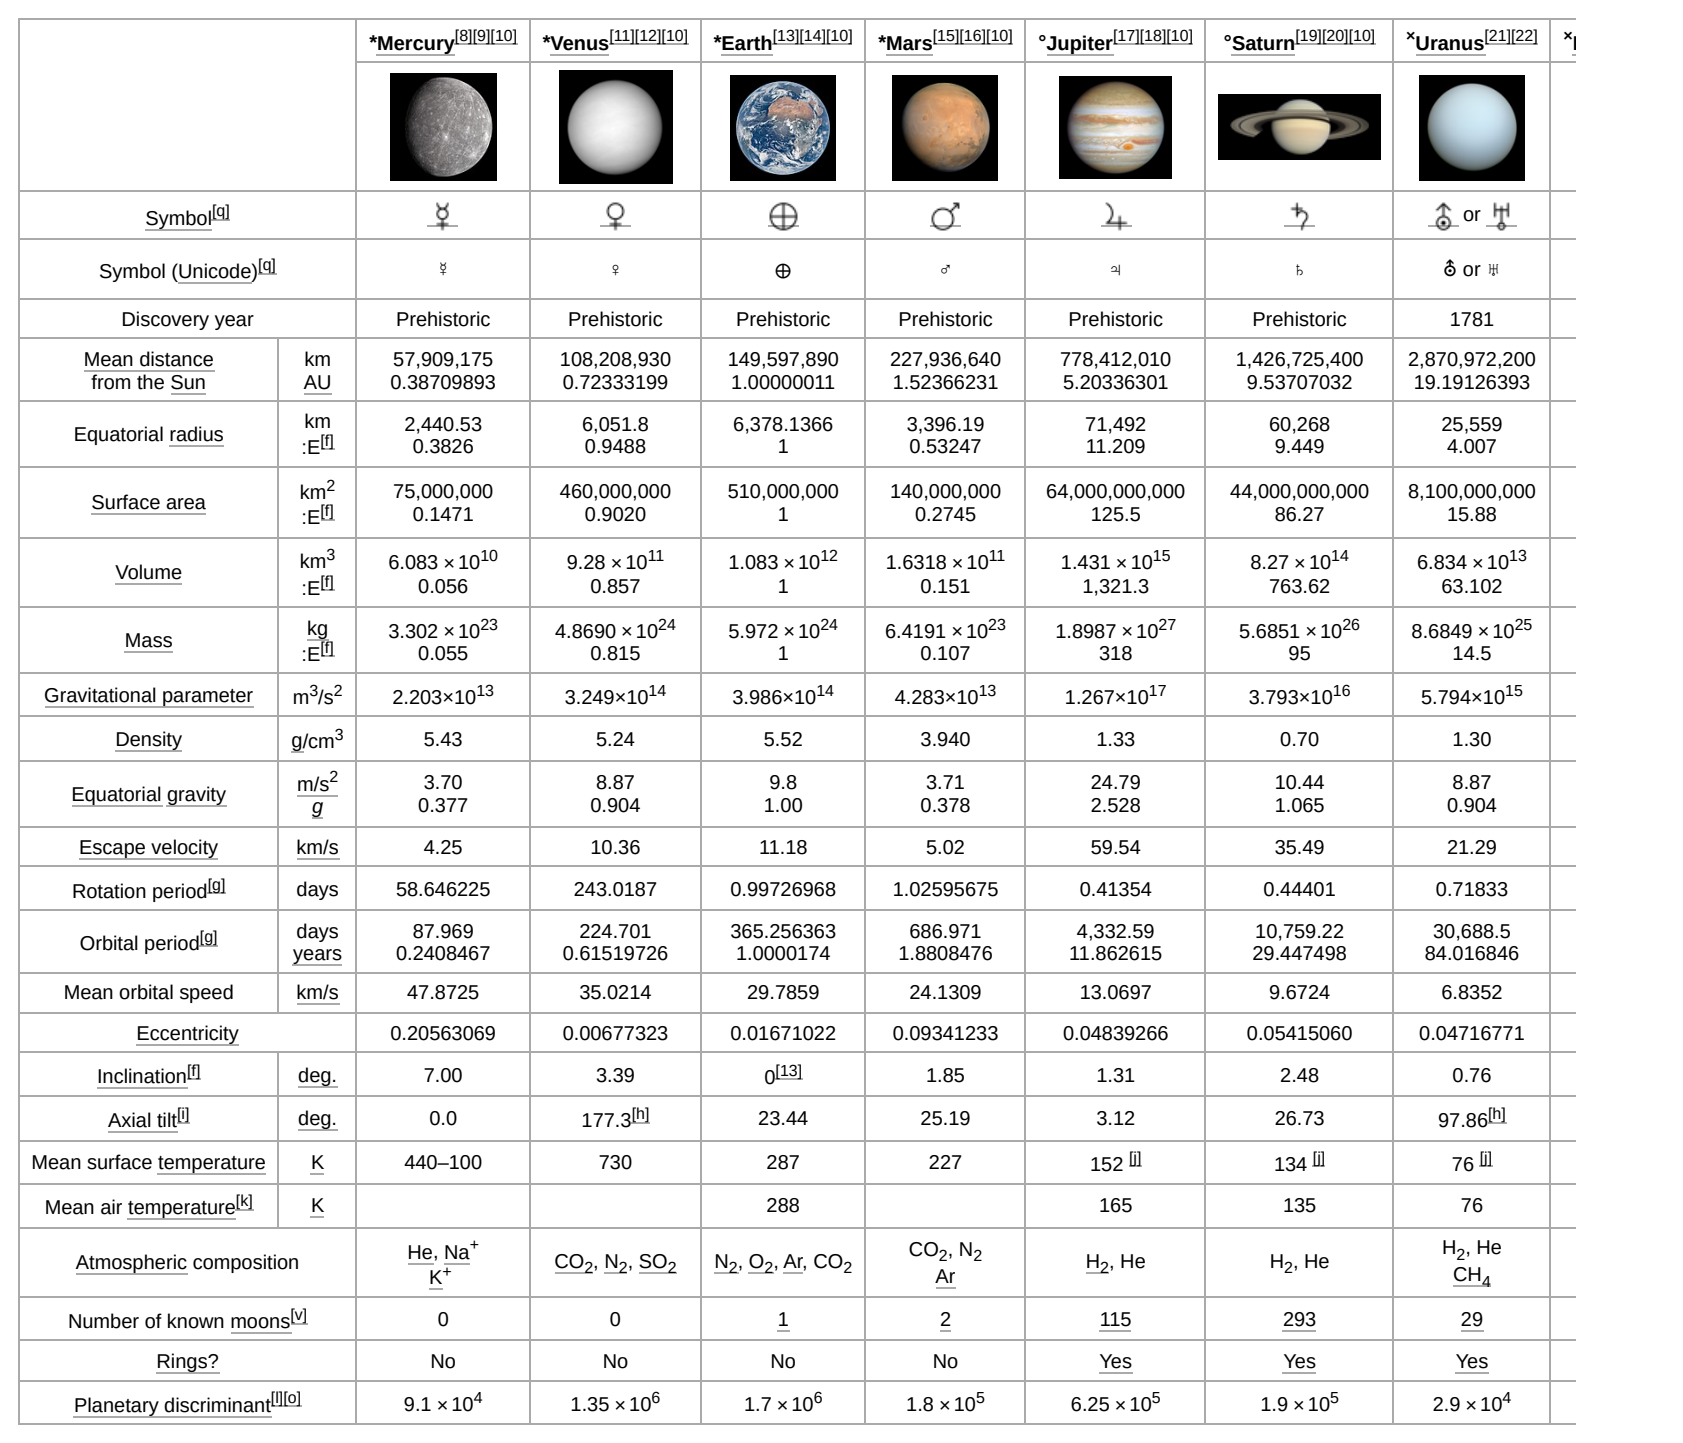
The PDF reader destroys the table on the way in, so every step after is working from nonsense.
"The table in our PDF has turned to nonsense. It gives me numbers, and they're the wrong ones."
A real example
The system has a real PDF with a real table of planetary data in it. It was asked:
What is Jupiter's equatorial radius?
6,378.1366 km
That's Earth's radius, not Jupiter's. Jupiter's is 71,492 km.
What actually happened
Here is the table, exactly as it appears in the PDF:
The planets table from the PDF, shown at full width. The PDF itself is pinned in this repository. Text and table from Wikipedia, reused under CC BY-SA 4.0. Two things are worth noticing before reading on: the units for each row live in that narrow second column, separately from every number they apply to - and the table is wider than the page, so Neptune has been cut off at the right-hand edge by the document itself.
A PDF doesn't store that grid. It stores instructions to put characters at particular spots on the page. Anything reading it back has to work out where the grid was, and here it got it wrong. The table became this:
Mean distance
from the Sun
km
AU
57,909,175
0.38709893
108,208,930
0.72333199
149,597,890
1.00000011
227,936,640
1.52366231
778,412,010
5.20336301
1,426,725,400
9.53707032
2,870,972,2
Eight planets, two units each, and nothing left saying which number belongs to which planet, or which of them is kilometres and which is astronomical units.
What reading it properly looks like
The grid isn't really gone. A reader that works out where the ruling lines are can rebuild it, and then write each row with values, units and meanings:
Mercury - Mean distance from the Sun (km AU): 57,909,175 0.38709893
Venus - Mean distance from the Sun (km AU): 108,208,930 0.72333199
Earth - Mean distance from the Sun (km AU): 149,597,890 1.00000011
Mars - Mean distance from the Sun (km AU): 227,936,640 1.52366231
Each line now carries which planet it's about, what is being measured, and what units the figures are in. Cut that into chunks anywhere you like and every chunk still makes sense on its own, because the meaning travels with the number instead of being left behind in a heading.
It's a simple fix: use a reader that understands table geometry. I used pdfplumber, it writes each value back out with its column heading, row label and units.
The same four questions, both ways
Four questions the table can answer, asked of the same PDF read each way. Every combination of chunk size and overlap was tried for both - 3 sizes against 4 overlaps - and the counts below are across all of them.
QuestionRead the usual waypypdf extract_text()Read with the table understoodpdfplumber extract_tables()
Marsdistance from the Sun
Read the usual way pypdf extract_text()
right 4 times in 11
the rest of the time, “I don't know”
Read with the table understood pdfplumber extract_tables()
right 11 times in 11
Mars is 227,936,640 kilometres from the Sun.
Jupiterequatorial radius
Read the usual way pypdf extract_text()
right 5 times in 11
once said 6,378.1366 km- that's Earth's figure, not Jupiter's
Read with the table understood pdfplumber extract_tables()
right 11 times in 11
Jupiter's equatorial radius is 71,492 km.
Saturndistance from the Sun
Read the usual way pypdf extract_text()
right 1 time in 11
the rest of the time, “I don't know”
Read with the table understood pdfplumber extract_tables()
right 11 times in 11
Saturn's mean distance from the Sun is 1,426,725,400 km.
Venussurface area
Read the usual way pypdf extract_text()
right 2 times in 11
the rest of the time, “I don't know”
Read with the table understood pdfplumber extract_tables()
right 11 times in 11
The surface area of Venus is 460,000,000 km2.
11 combinations of chunk size and overlap were tried. It never once got all four right. Parsed properly, it got all four at 11 of the 11.
Incorrect values. A refusal is honest and you will notice it. The wrong number is the one that reaches users and causes data integrity issues and mis-trust in the system.
Full written explanation
Symptom
Numbers come back from a document that contains tables, and they're the wrong numbers - often another row's or another column's, delivered confidently.
What's happening
A PDF stores the position of characters, not the structure of a table. Text extraction has to reconstruct the grid, and for a wide or transposed table it frequently can't. The values survive; what is destroyed is the relationship between each value and the heading that gave it meaning.
The check
Print the extracted text of a page you know contains a table and read it. Not the PDF - the text your pipeline actually indexed. If you can't tell which number belongs to which row, neither can the model, and no retrieval setting will change that.
The fix
Upstream, at the parser. Use a reader that understands table geometry and write each value back out carrying its column heading, row label and units. Measured here: that answered 44 of 44 questions correctly across every setting, with no wrong answers at all.
What doesn't work
Chunk size, overlap, or asking for more results. All three assume the information is present and merely badly organised. Here the meaning was destroyed before any of them ran. They do move the score around, which is precisely why they're so tempting.
A second corruption, which turned out not to matter
Superscript exponents are flattened by both readers. The Sun's mass, written 1.9855×1030 kg, comes out as "1.9855 1030" in the extracted text either way, which as a figure is wrong by twenty-seven orders of magnitude.It doesn't produce a wrong answer, though. Handed that text and asked for the Sun's mass, the model replies "1.9855 × 1030 kg". It repairs the exponent, because no other reading of the number makes sense for a star, and it does the same for obscure bodies whose masses it can't plausibly know from memory. Worth stating because the opposite is easy to assume: a corrupted figure in the text isn't automatically a wrong answer, and the difference is only visible if you ask rather than reason about it.
Every setting, in full
The counts above summarise these. Each figure is how many of the 4 questions were answered correctly at that setting.
Chunks of
Overlap
Read the usual way
Read properly
300
0
1 of 4
4 of 4
300
50
1 of 4
4 of 4
300
150
3 of 4
4 of 4
600
0
0 of 4
4 of 4
600
50
1 of 4
4 of 4
600
150
3 of 4
4 of 4
600
300
1 of 4
4 of 4
900
0
1 of 4
4 of 4
900
50
1 of 4
4 of 4
900
150
0 of 4
4 of 4
900
300
0 of 4
4 of 4
How this was measured
The same pinned PDF, parsed two ways, swept over the same grid of chunk size, overlap and top-k. 'naive' is pypdf's plain text extraction, what an ordinary pipeline does. 'table_aware' is pdfplumber's table extraction with every value written back out carrying its column header, row label and units - the upstream fix. Scored by what the model actually answers when handed the top 4 chunks, not by whether the right numbers happen to appear together: the lenient co-occurrence test says the naive parsing succeeds at 900-character chunks, because the header row of planet names lands in the same chunk as the bare stream of values, while nothing in that chunk says which number is which planet's. Answers generated by glm-5.1:cloud with the top 4 chunks supplied. The four questions were also asked with no passages at all, and with one irrelevant passage, to confirm the model was reading the document rather than reciting well-known figures: it refused every time.